The Pandemic Recession, part 4: Lockdowns &c.
Let’s turn to perhaps the most controversial response of Governments to the Covid-19 pandemic: Lockdowns. We will begin with the thought that lockdowns save lives but have economic costs. Can we draw the Pandemic-Possibility-Frontier associated with different severities of lockdown?
Figure 1 does exactly this for the US, each point on the solid blue line in the figure represents a different duration of lockdown, with the horizontal axis showing the loss of life associated with this duration of lockdown, and the vertical axis showing the loss of income. So the top left is long lockdowns that cause large income loss, but little loss of life, and the bottom right corner is no lockdown which results is little loss of income but large losses of life. The flat part on right is when ICU reaches maximum capacity and deaths spike (ICU is Intensive Care Unit, in Hospital). The flat part on the left is when lockdown is severe enough to get people vaccinated before a second wave of virus. The underlying model assumes a vaccine will arrive after 18 months, and that number of ICU beds is fixed/limited. The blue line also assumes that the US Government provides the same fiscal support as it did in practice. The orange line represents the same lockdowns, but now without the fiscal support with which the lockdowns in the US were combined in practice. The model also estimates different costs for different people: putting them in order from least economically impacted to most economically impacted we can draw the 10th and 90th percentiles, these are the lower and upper edges of the colored regions. E.g., with US policy (lockdown plus fiscal support) the average economic loss is 3 months income, but 10% of people experience less than 1 month income loss and 10% of people experience more than 4.5 months income loss (roughly).
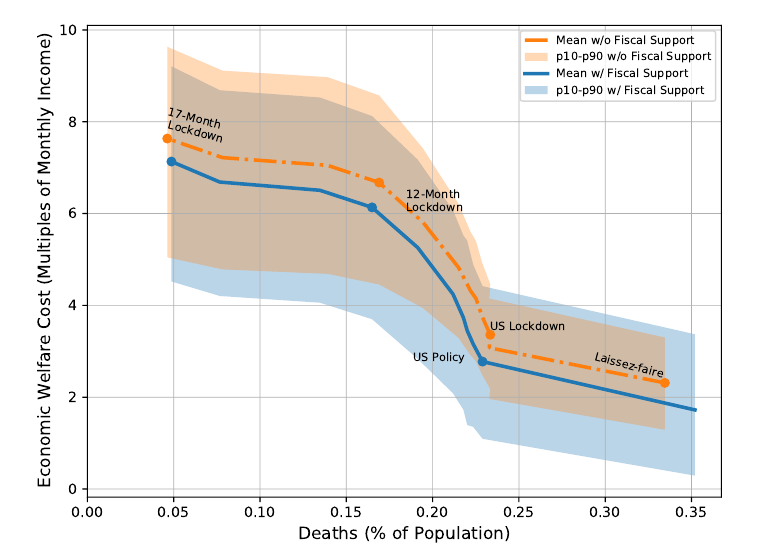
The model used by Kaplam, Moll & Violante (2020) that underlies this Pandemic Possibility Frontier combines a SIR model with a heterogenous agent economic model. SIR is the standard epidemiological model of how a virus spreads and was discussed in the first post of this series. A heterogenous-agent incomplete market model is a standard macroeconomic model of the economy which contains many different people. Model allows for the fact that some people work in occupations that are more contact-intensive, and that some consumption goods (e.g., concerts) are more contact-intensive. More contact-intensive work and consumption increases spread of virus. People in the model decide how much risk of catching the virus they will expose themselves to on the following logic: I choose to avoid contact-intensive activites to minimize my own personal health risks, but I do not take into account the additional health benefits to others of me not getting sick meaning others are less likely to get sick too (as they then cannot catch virus from me). As a result the model has negative health externalities mean if we asked the model which policy was ’pareto optimal’ it would prefer some lockdown. Note however that model was not asked which policy was the pareto optimal, instead it was used to draw the trade-offs as captured by the Pandemic Possibility Frontier, which is mathematically the same concept familiar to Economics in the form of the Production Possibility Frontier when thinking about firms. They find that those most economically exposed to virus are also the most financially exposed in the sense that the loss of income will lead to reduced consumption as they have few assets and little ability to borrow. That is, those who lose the most income are the people with high MPC. The most economically exposed are people who work in contact-intensive occupations which are ’rigid’ in sense there is no decent online/remote alternative. This is based on data, not the model. The model helps spell out the macroeconomic implications of this finding. Another finding based on data and not the model is that the biggest economic losses of US lockdown were for middle incomes. Low income households lost the most in job earnings, but fiscal policy was generous enough to more than fully make up for their losses, so much so that the US poverty rate was almost cut in half. Middle income households lost a smaller share of income, but fiscal policy only partly makes up for their losses. High income households typically kept working so did not experience much income loss.
What about other Government policies like covid tests, self-isolation/quarantining, mask mandates, and contact tracing? Masks and Social Distancing are ‘non-pharmaceutical’ interventions. Absent development of pharmaceutical interventions they simply delay the pandemic. No vaccine was ever developed for the 1918 Spanish flu pandemic. Testing and Quarantining are pharmaceutical interventions that once developed allows a partial economic reopening without further loss of life. Are also useful if reinfection if possible (e.g., due to virus mutations). Same thing for tracing although the privacy implications make this more onerous. Economic models similar to those described predict that effective tests combined with (perfectly enforced) self-isolation/quarantining can massively reduce both deaths and economic losses (Eichenbaum, Rebelo & Trabant, 2020). Better medical treatment for those who do fall ill with the virus also improves the trade-offs by allowing some combination of partial reopening and less loss of life. The death rate among infected has fallen since beginning of Covid-19 pandemic as medicine better understands how to treat those infected (drugs, assisted breathing equipment, etc.). All of these can be understood as other ways to shift the pandemic possibility frontier down/left. If you want a detailed idea of what policies various countries took here is a link to a variety of indexes measuring the ‘Policy Responses to the Coronavirus Pandemic‘, with lockdowns being the ‘Government Stringency Index’.
Let’s return to Lockdown which clearly saves lives, but what about the economic impacts? Evidence suggests short & sharp lockdown offers better trade-offs in terms of the economy and human life. Short & sharp lockdown allows the economy to then be reopened sooner. The large short term loss of output is more than offset by the longer term improvement in output. (Arias, Fernandez-Villaverde, Rubio-Ramirez & Shin, 2021; estimation based on Belgium.) Note in this context that the Pandemic Possibility Frontier seen earlier comes from a study that considers lockdown and no-lockdown, as well as the duration, but not the intensity of the lockdown. Hence it had nothing to say about this issue. So strict lockdown is good for the economy…
…in high-income countries. In low-income countries, such as India, lockdown appears to have saved fewer lives and not saved the economy. If you live in a slum in Mumbai (1 million people in 2 sq kms) during a lockdown are you really isolating your household? More importantly lockdown in poor countries means starvation. In high-income countries everyone has a bank account and governments made electronic money transfers which people could use to buy food from supermarket. In low-income countries many do not have bank account nor are there the distribution networks underlying supermarkets. Nor do the poor have any savings. If they don’t work that week they don’t eat that week. When India locked down poor people fled cities, where they would have starved, to their villages. Spreading covid from the cities to the rest of the country. This happened again in India’s second wave. In a low-income country like India covid-19 is far from the only disease causing death: in 2017 more than 3000 Indians died per day from tuberculosis or diarrhea. The economic loses have been massive and tragic. India’s middle class ($10-20 per day) shrunk by one-third, with 32 million people falling into poverty. After two decades of rapidly falling Global Poverty, 2020 saw the first rise in global poverty since 1998. Prior to Covid-19 it had been widely predicted that the end of extreme poverty (<$4 per day) was approaching. The next few years will see if this setback is temporary or permanent, let us sincerely hope it is temporary.
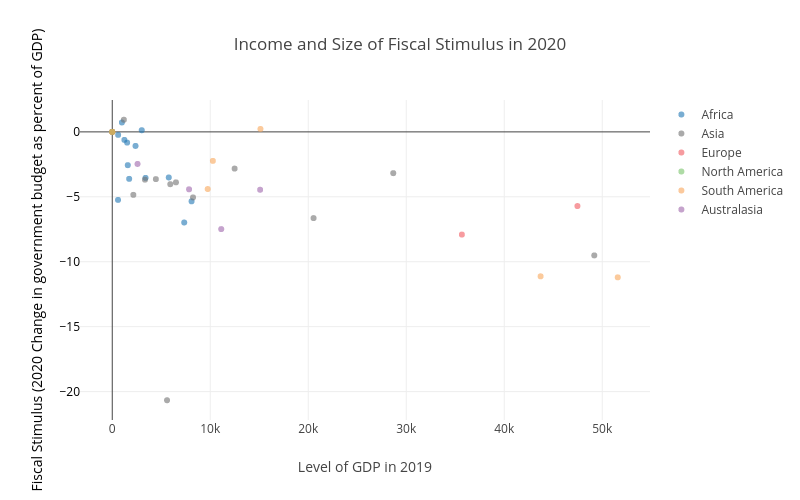
Figure 2 shows the ‘difficulty’ low-income countries have faced in deploying the kind of large fiscal support seen in high-income countries. On the right are the high-income countries, and being lower on the vertical axis shows that they have done large fiscal stimulus. By contrast the low-income countries on the left are higher up as they have had much smaller fiscal stimulus. This partly reflects different administrative capabilities, with high-income countries better able to coordinate and execute large increases in spending. But mostly it reflects that the ability to engage in large fiscal stimulus depends on being able to borrow the necessary money. High income countries have larger tax revenues (so better ability to repay the debt). High income countries have the financial infrastructure needed to borrow and transfer/spend large amounts of money quickly. High income countries also have more stable government, so are more trusted to repay debt in the future. Economists often refer to ‘fiscal space’ to describe the room to borrow of countries.
Many low and middle income countries have seen increases in hunger and poverty (Brazil, Argentina). School-closures in high-income countries meant online-education (an imperfect replacement). In low-income countries it meant no school. This led to an increase in children working in developing countries. Low and middle income countries tend to be younger (fraction of population aged over 65, and hence most vulnerable to covid-19, is smaller). So ceteris paribus should have been less affected. Of course in practice not everything else is equal.
I personally have wondered if Asia may not be less affected, ceteris paribus, due to genetic resistance to the family of viruses to which Covid-19 belongs, given that the virus originated in China? There is evidence of a coronavirus 20,000 years ago that left a mark in the DNA of many people in East Asia. The idea being much like how smallpox which was moderately deadly among Europeans, devastated the inhabitants of the Americas when it came over with the Europeans shortly after Columbus. Having lived with smallpox for centuries Europeans were less susceptible. Smallpox is thought to be an important part of why after Cortés first took over the Aztec empire his small group of Spaniards and their Indian allies they were able to hold it, with smallpox killing 50% of the population. There is also one documented incident of smallpox-laden blankets being deliberately given to Shawnee and Mingo native americans in the USA in an attempt to kill them; the US military is documented as wanting and planning to do so, but there is no documented evidence that they followed through and did so. Note that the present paragraph is pure speculation on my part, I am not aware of evidence that people of East Asian origins are less vulnerable to Covid-19.
Obviously the most important thing for finally dealing with a pandemic is vaccination. It largely ends the deaths at little to no economic cost. Doses of the main Covid-19 vaccines cost only around $20 each. (You need two doses of most vaccines.) Even after paying for all the additional distribution and administration costs of vaccination, hundreds of dollars per dose, this is vanishingly small compared to the costs of lockdowns and social distancing. Not to mention vanishingly small compared to the value of a human life. The pace at which this can be done (safely) is key. In practice, as well as the issue of safety, there is the challenge of ramping up production quickly. Offering large prizes is thought to be a very cost effective way to encourage innovation and countries did this to encourage vaccine development (e.g. US Operation Warp Speed). Vaccination eliminated smallpox in 1979 after centuries of deaths (300 million deaths in 20th century alone). The key was not just developing the vaccine but making it easy, cheap, and widely available as part of a major public health campaign.
Let’s look at two more aspects of the Pandemic Recession. What happened to asset prices, and the moral questions raised.
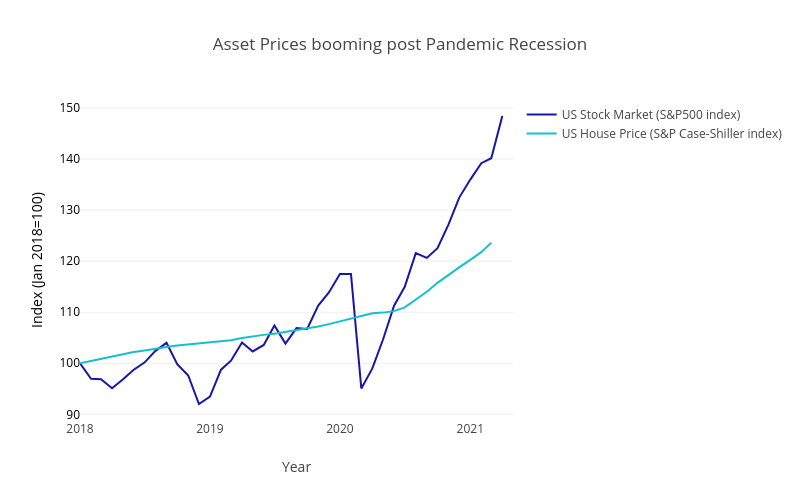
Stock markets and house prices have risen massively, with the US experience shown in Figure 3. While the stock market experiences a big fall early in 2020 this quickly turned around and by late 2020 was well into a boom. There are a few main explanations for this which we will now look at in turn. Part of the rise in asset price reflects lower interest rates. The role of low interest rates in high asset prices can be understood in terms of present value. The ’Present Discounted Value’ of $100 next year is $100/(1+r) now, where r is the interest rate. When interest rate r decreases the same ’future value’ becomes a larger present discounted value. Stocks and houses are assets you buy today that pay out in the future as dividends and rent, respectively. So the price of these assets will increase when the interest rate decreases (ignoring for simplicity any changes in future dividends and rent, which may also have been influenced by the pandemic). Another part of the rise in asset prices reflects the ’excess savings’. It is estimated that $170 billion from the second US stimulus would flow into the stock market. Small investors normally account for 10% of trading in US, they are estimated to be 25% during pandemic. Essentially all the excess savings being invested in the same existing assets means higher asset prices. Another part of it will likely turn out to be a bubble. I here use ’bubble’ to describe a steep price rise followed by sharp price fall, not necessarily in a pejorative sense.
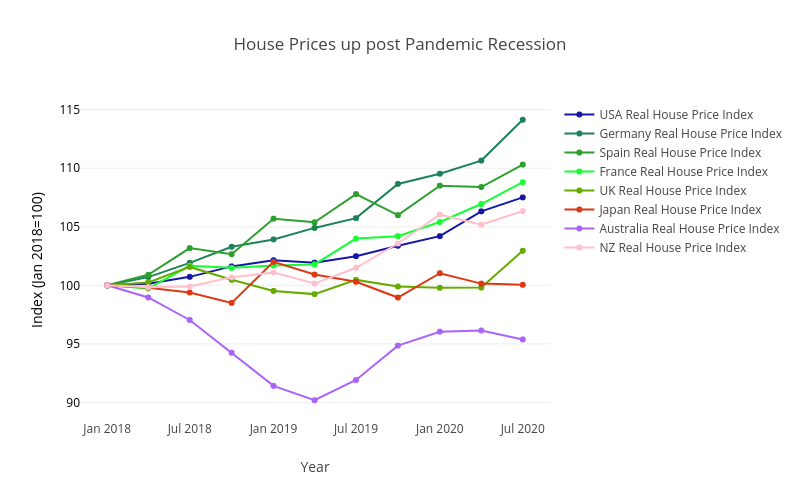
This is not just true of the US. Figure 4 shows that these increased house prices are widespread among high-income countries. As well as more demand for housing there has also been a change in kind of houses people want to buy. Less inner-city apartments, more single-home in mid-size cities or suburbs. More ’home office’ space. On the other hand there has been a major fall in occupancy rates for commercial office space.
The Pandemic has highlighted the important role of ethical and moral judgements in the decisions we make as society and as individuals. Is it ethical for airlines to require proof of vaccination before letting you board an airplane? What about your employer requiring proof of vaccination before letting you come to work? Or your employer requiring a negative covid test? Note that some employers already require, e.g., negative tests for drug use such as THC (marijuana). Examples as of mid 2021 include that France and Italy now require vaccination (or negative tests) to go to Restaurants. All public employees in California must be vaccinated or have weekly tests. More generally any decision on how much we should try to reduce deaths from Covid-19 versus avoiding lost income, lost jobs, family seperation, loneliness and mental health, lost education (test-based evidence shows students learn less with remote teaching), etc., clearly involves important moral judgments and personal opinions of what is important in life.
The final post in this series looks Post-Pandemic.
If you are lost here is a link to the first post in this series on the Pandemic Recession.