The Pandemic Recession, part 3: Fiscal and Monetary
How did governments respond to the Pandemic? We might think of all sorts of policy responses such as lockdown, travel restrictions, mask-wearing, vaccination, etc. Here we will focus on the Fiscal and Monetary responses, while the next post in this series looks at things like lockdown and covid tests.
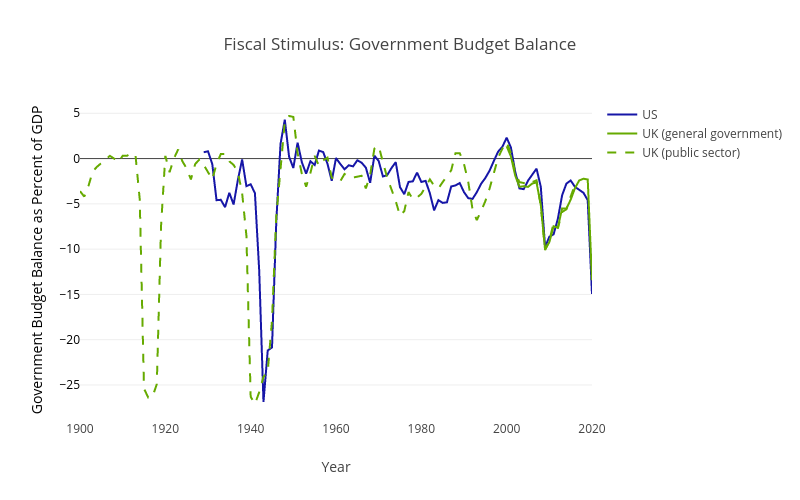
The first thing to observe about the fiscal stimulus response (government spending and tax cuts) is that it has been massive! Not just in terms of the number of dollars and Euros involved, but also historically. Figure 1 shows the size of the resulting fiscal budget deficits for the US and UK, both of which are they largest they have ever been in peacetime. A move into fiscal deficit occurs due to a combination of increased spending and decreased tax revenue, both of which represent fiscal stimulus.
What effect did this massive Fiscal stimulus have on the economy? Another way of asking this same question is how big was the fiscal multiplier?, that is, how big was the change in output divided by the change in government spending (and tax)? It is impossible to estimate the actual fiscal multiplier for any given recession (it can be and is estimated for recessions on average). But let’s use our two-sector model of a ‘negative supply shock that leads to a negative demand shock’ from the previous post to think about whether the Fiscal Multiplier is likely to be bigger or smaller than usual. We will begin with the relationship between the Fiscal Multiplier and the Marginal Propensity to Consume (MPC) that derives from the standard undergraduate Macroeconomic model of Aggregate Expenditure (a.k.a. the Keynesian Cross model). In the Aggregate Expenditure the Fiscal Multiplier=1/(1-MPC). Recall the logic for this result: $100 of spending is $100 of income for someone, who will then spend MPC, fraction of that, which is $MPC*100 of income for someone, who will then spend MPC fraction of that, etc., etc. (Remind me.) Our two-sector model of a ‘negative supply shock that leads to a negative demand shock’ predicts that the Fiscal Multiplier will be much smaller! We can follow the same logic as before to see why the Fiscal Multiplier will be small, based on the idea that the MPC is different in the two sectors. The MPC is high for those in the contact-intensive sector that got shut down as they lost all their income and so they would have to cut back on spending. Any extra income allows them to avoid this and so they will spend it, which is to say they will have a high MPC. The MPC is low for those in the non-contact sector as they have keep their jobs and so will smooth the consumption of any one-off additional income. These two MPCs together give a small Fiscal Multipliers as follows: Give Fiscal Transfer of $100 to those in closed contact-intensive sector. Their (very high) MPC was one (in toy example), so they spend $100, but all this goes as income to those in the not-contact-intensive sector who still have their jobs and have lower MPC (was 0.66 in toy example). All the further rounds are based on this lower MPC. So our Fiscal Multiplier is now mostly based on the lower MPC. So the Fiscal Multiplier is smaller. (To be precise the Fiscal Multiplier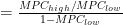


On the one hand, a low fiscal multiplier suggests that fiscal stimulus is not as worthwhile as it normally would be. But it is important to note that much of the fiscal policy during the Pandemic Recession was more deliberately redistributional, with a goal of helping those who lost all their income due to government-mandated lockdowns, than it was necessarily about stimulating the aggregate economy. This leads us to another important observation about Fiscal policy during the Pandemic Recession.
The Political Economy of transfers has been very different in the Pandemic Recession. Transfers to those sectors most impacted in a recession normally raise concerns about moral hazard. For example bailouts to bankers during the 2007-9 Financial Crisis and the ensuing Great Recession raised huge concerns about moral hazard. Moral hazard is the concern that bankers, knowing they will be bailed out, deliberately take even bigger risks thereby making financial crises more likely. (Also seen as rewarding them for their past indiscretions.) By contrast there has been little worry that transfers to waiters whose restaurants were shut during Pandemic will create moral hazard. There is a widespread view that those hit hardest by the pandemic are not responsible for finding themselves in that position and so should not be blamed for it. There is no apparent concern that transfers will make people more likely to work in pandemic-exposed sectors in the future. So while smaller Fiscal Multipliers might argue for less Fiscal Stimulus, a major constraint on Fiscal Stimulus is normally moral hazard concerns and bailing out those ‘responsible’ for the recession which have been largely absent during the Pandemic Recession and perhaps helps explain why the fiscal responses are huge by historical standards.
Enough about the general concepts of Fiscal policy. What kinds Fiscal Policy actions have been taken? High-income countries did two main kinds of policies: (1) Subsidised/cheap loans to business, and (2) Income transfers to individuals. Evidence from the UK suggests that the subsidised/cheap loans to business did succeed in the goal of rescuing normally profitable firms that might not have survived lockdowns, but that it may also have keep alive a few weaker firms that would have failed in normal times. We will focus here on a specific aspect of the income transfers, namely that in the US they were mostly in the form of direct-transfers of money and unemployment benefits, while in other countries they were mostly in the form of transfers via employers. These programs which paid employees who would otherwise see their hours reduced or be fired are called ‘short-work’ programs (from the German Kurzarbeit). Roughly speaking short-work programs involve the Government transferring money to employers on the condition that these firms continue to keep employing the worker on, e.g., half the hours and paying half the wage while the Government pays the other half of the wage. This difference between how the Government made income transfers had a huge impact on employment rates. In Figure 2 you can very clearly see how much bigger the US employment fall was. And how little employment fell, particularly in Europe which made widespread use of short-work programs, especially given how deep the recession was. Unemployment showed the ‘opposite’, a spike in the US but not other high-income countries. Emerging economies typically do not have the combination of money and administrative capability for short-work programs and so saw falling employment.
So short-work programs clearly prevented employment rates from falling. But are they a good idea? Short-work programs subsidize ’labor hoarding’, where firms continue to employ workers that are not currently needed but may be needed in the future. This could be efficient if there is firm-specific human capital and liquidity-constraints on firms, or if there are costs to hiring/firing plus some kind of negative externality from job search, and if the post-pandemic economy involves workers in the same sectors as before. Will be inefficient if the post-pandemic economy needs the workers to be in different sectors than before (as delays the needed restructuring). Negative externalities of job-search are standard in ’search-and-matching’ models: when you are searching for a job your probability of getting a job is decreased when other people are also searching for a job; a ‘congestion’ externality. To put it another way, for short-work programs to be efficient there needs to be a reason ’labor hoarding’ is a good idea, but also a reason why firms can’t/won’t just do so themselves.
Germany has long had ’Kurzarbeit’: a firm facing revenue loss can apply for a time-limited short-work subsidy (the firm pays workers part-time wage for part-time work, government tops this up to the full-time wage). These programs have become increasingly popular in Europe. Estimates for Germany indicate that 2.35 million employees (almost 6% of total employment) will receive Kurzarbeit during the COVID-19 crisis, compared to 1.4 million at the peak of the Great Recession. In France, 730,000 employees (2.8%) are currently being paid by the French short-time work scheme. In Belgium, 100,000 people were on short-time work at the peak of the Great Recession, while during Pandemic 1 million are (22%). The Pandemic saw short-work programs implemented for the first time in Australia, New Zealand & UK. Australia called theirs JobKeeper and it payed wages of employees. Initially for all, and then after initial round ended the program was modified to allow only employers who were losing money due to covid-19 to get JobKeeper for their employees. In New Zealand it was called Wage Subsidy and paid wages of employees and self-employed. Any firm that had a 40% decline in revenue due to lockdown was eligible and it has been repeated during each lockdown. The UK called theirs Furlough and paid the wages of employees for hours they cannot work due to lockdowns. Furlough applies across the UK and covers up to 80% of an employee’s salary for the hours they can’t work, up to a maximum of £2,500 per month.
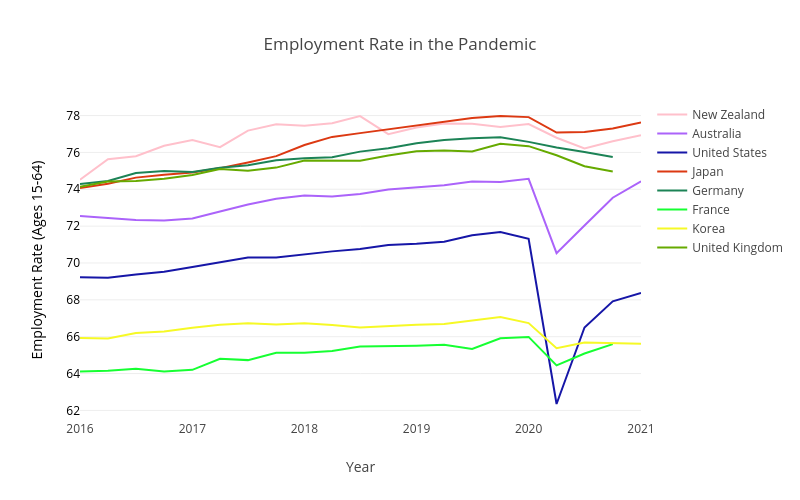
While looking at employment let’s take the opportunity to consider some gender and age aspects of the recession. We can see employment rates by gender for the US in Figure 3. As can be seen both males and females suffered large job loss during the recession and quickly recovered most of the loss afterwards. There is not much difference by gender, although most countries saw female employment fall slightly more in the recession (due to working in more contact-intensive sectors; Furman, Kearney & Powell, 2021), but then also recover faster/higher afterwards. This is notable mostly because it is the opposite of most recessions, where male employment falls more (Albanesi & Kim, 2021). This does not mean that there are no concerns about different impacts of the recession on men and women. Simply that these have tended to focus much more on that with children at home (schools closed) there was imbalance in terms of workload with women expected to do more of the ’extra’ childcare. For those interested here are graphs of employment rates by gender for Australia, Germany, Japan, New Zealand, and the UK.
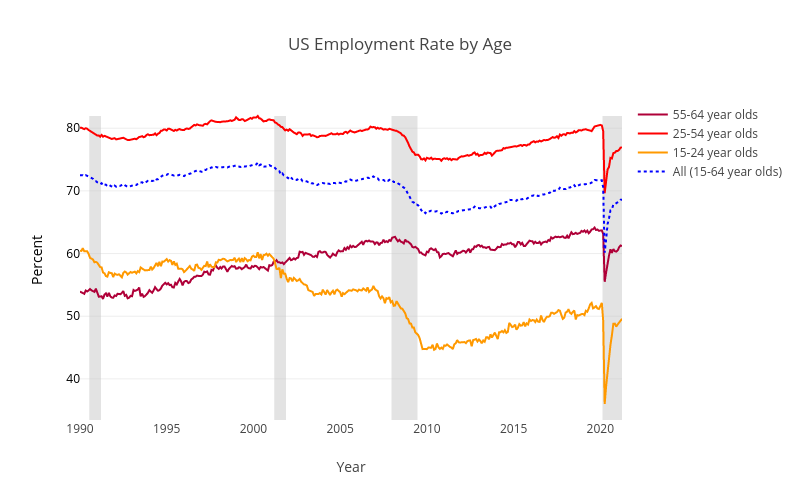
Employment rates by age for the US are shown in Figure 4. The elderly were hit much harder than usual in this recession. The young were hit hardest, but this is standard in recessions and not specific to the Pandemic Recession. Note in the graph that the initial fall for young is bigger, but overall fall for elderly is much larger than usual. In previous recessions employment of older people hardly falls, but in pandemic recession it has fallen by similar magnitudes to young. Most countries see unusually large employment losses for older workers. One way this has manifested in the US is with a jump in retirement, which has otherwise trended downward in recent decades. For those interested here are graphs of employment rates by age for Australia, Germany, Japan, New Zealand, and the UK.
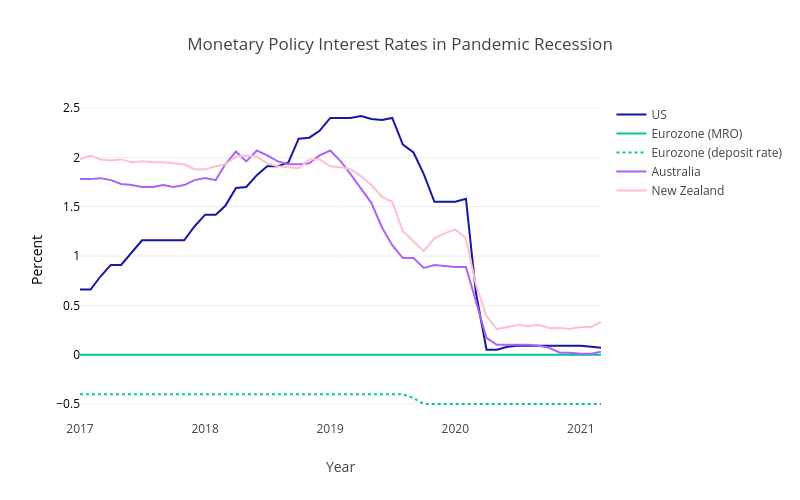
We turn now to Monetary Policy and it’s reaction to the Pandemic Recession. Unsurprisingly the first thing Central Banks did was to rapidly cut interest rates to zero, except in the Eurozone where the rate was already at zero. Figure 5 shows these cuts in interest rates. The European Central Bank (ECB) has a main rate (called MRO) which remained at zero and also a secondary ‘deposit rate’ which can be negative.
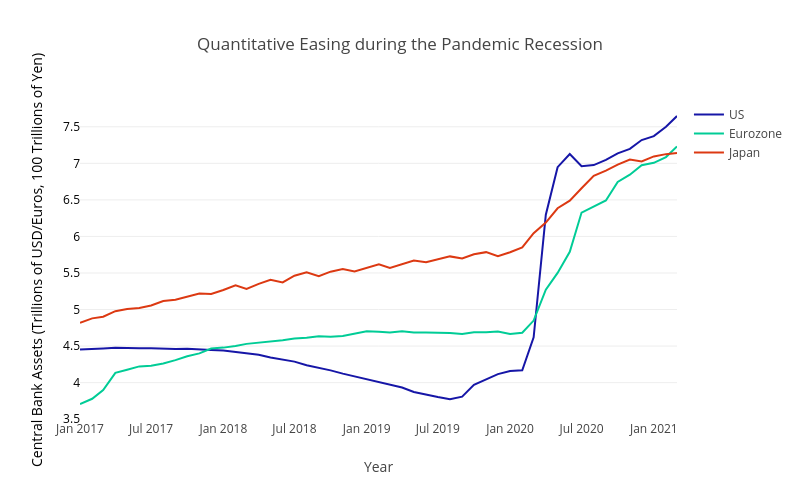
Having run into the zero lower bound, Central Banks quickly turned to Quantitative Easing (QE). Quantitative Easing involves the Central Bank buying assets (e.g., 10 year government bonds, or corporate debt, or mortgages; details differ by country and time). So in Figure 6 we can see QE as an increase in Central Bank Assets. To get an idea of the size —how much is a trillion dollars?— it helps to think about things as a percentage of GDP. The increase in the second quarter of 2020 is 15 percentage of GDP for the US, 13 for the Eurozone, and 18 for Japan (graph).
By early March 2020 many corporations and households were desperately selling assets to raise cash to cover immediate needs. Normally during a crisis US Treasuries see interest rates fall due to increased buying in a ’flight to safety’ and this occurred in Feb 2020. But in early-mid March interest rates on 10-year US Treasuries began to jump up due to rampant selling (graph). US Treasuries is considered one of the most liquid markets in the world and the breakdown of Treasury market was bigger than during Great Financial Crisis (GFC) of 2007-09 which saw massive flight-to-safety into US Treasuries, but never big selling out of US Treasuries. (Flight-to-safety: people sell risky assets, like shares, and buy safe assets, like US Treasuries.) The US Federal Reserve held an emergency meeting on Sunday 15th March and decided to buy $500bn of US Treasuries plus $200bn of mortgage-backed debt. One week later it had already increased this to ’unlimited’, to put it mildly this was a large Quantitative Easing program and as evident from earlier graph they ended up spending around $3trn by mid-2020.
Australia and New Zealand, which had not needed QE during Great Recession, both embarked on QE in response to the Pandemic Recession. Large-Scale Asset Purchases (LSAP) in New Zealand saw the Reserve Bank of New Zealand authorised to buy up to NZ$100bn of Government bonds (national and local). As of June 2021 RBNZ had bought NZ$57bn. In Australia the Reserve Bank of Australia purchased AU$200bn. Interestingly the QE of Australia and New Zealand was not your Grandfather’s QE (your Grandfather in this case being the Great Recession of 2007-09). The original motivation of QE during the Great Recession was to bypass banks in getting money/credit to firms and households. During the GFC the US first tried buying all the distressed assets from banks (TARP), but the banks just kept all the money from this, typically as reserves at Central Bank, instead of lending it to the broader economy. In response the US embarked on it’s first QE program as a way to buy assets (debt assets) directly from the market, bypassing the banks. During the Pandemic Recession this remained true for the US where the Federal Reserve also bought mortgage-backed debt, bailed out money-market funds (again), and even corporate debt. But it is not true in Australia and New Zealand where the Central Banks only purchased government debt since the Government Bonds were mostly purchased from Banks, so their QE mostly works via banks.
Alongside the asset purchases of QE many central banks went much further in providing credit for all. The US Federal Reserve directly purchased corporate debt, made long-term loans directly to banks, and helped mid-size firms secure loans. Essentially, the financial system broke down, but because Central Banks stepped in with so much lending people ended up still able to access credit just fine. In many cases the Central Bank has massively expanded credit to banks which have in turn expanded credit to firms and households. Another policy many Governments instituted in relation to providing credit was a temporary freeze on mortgage payments, which massively reduced households need for credit to cover their regular expenses. The US did, as did Australia which had 850,000 mortgages deferring payments, but by early 2021 the program ended and there were just sub-5000 still deferring.
Enough of Fiscal and Monetary, in the next post we look at lockdowns and other related aspects of the response to Covid-19.
If you are lost here is a link to the first post in this series on the Pandemic Recession.
Here is a brief list of the main fiscal policies enacted in each of the USA, Australia, and New Zealand:
Fiscal Policy in USA included:
– First stimulus (March 2020): $2.2trn.
$1,200 to individuals earning up to $75,000, with smaller payments to those with incomes of up to $99,000 and
an additional $500 per child. Increased unemployment benefits by $600 per week. $377 billion in federally
guaranteed loans to small businesses and $500 billion government lending program for distressed companies.
– Second stimulus (March 2021): $1.9trn.
$1400 checks to everyone, jobless aid of $300 a week, and aid for states, cities, schools and small businesses.
There are also an Infrastructure plan and a Families plan that sum to $4trn.
These are the main programs by cost. Both stimulus bills also included billions for hospitals, vaccination, and the like.
Fiscal Policy in Australia included:
– Allowing people to make withdrawals from superannuation funds.
Normally only possible at retirement.
– JobKeeper: payed wages (a short-work program).
Initially for all, then after initial round ended the program was extended for employers who were losing money due to covid-19 to get JobKeeper for their employees.
– Income stimulus payments.
Penioners, Families & Carers got two payments of $750 each and another two of $250 each.
– Coronavirus supplement.
Roughly, anyone receiving benefits got an extra $250 per fortnight.
These are the main programs by cost.
Fiscal Policy in New Zealand included:
– Wage Subsidy Scheme: loosely, paid wages of employees and self-employed.
Any firm that had a 40% decline in revenue due to lockdown was eligible. Has been repeated during each
lockdown.
– COVID Income Relief Payment: $490 per week for 12 weeks for those who lost jobs.
– Small Business Cashflow Scheme: cheap loans to small businesses that lost 30% of revenue.
No interest if repaid within 2 years. Otherwise 3% interest.
These are the main programs by cost.
Comments are Disabled