Shows how to use getFredData and plotly together with a for-loop to easily create graphs showing multiple different countries.
Matlab codes (take advantage of fact that often different countries data just involves using a different code, eg. US vs DE for USA or Germany):
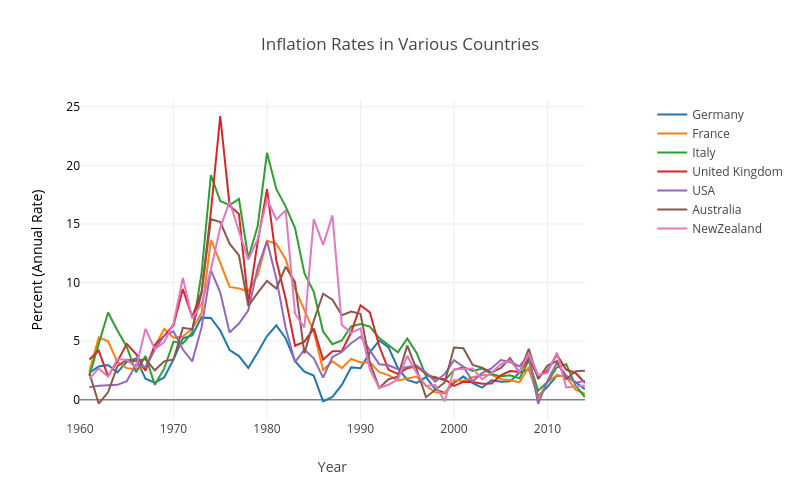
%% Inflation Rates in various countries
CountryCodes2LVec={‘DE’,’FR’,’IT’,’GB’,’US’,’AU’,’NZ’};
CountryCodes3LVec={‘DEU’,’FRA’,’ITA’,’GBR’,’USA’,’AUS’,’NZL’};
CountryNameVec={‘Germany’,’France’,’Italy’,’United Kingdom’,’USA’,’Australia’,’NewZealand’};
ColorStringVec={‘#1f77b4′,’#727272′,’#f1595f’,’#79c36a’,’#599ad3′,’#f9a65a’,’#9e66ab’,’#cd7058′,’#d77fb3′};
StartDate=’1960-01-01′
EndDate=’2014-12-31′
data={};
for ii=1:length(CountryCodes2LVec)
CountryCode2L=CountryCodes2LVec{ii};
CountryCode3L=CountryCodes3LVec{ii};
CountryName=CountryNameVec{ii};
if strcmp(CountryCode2L,’AU’) || strcmp(CountryCode2L,’NZ’)
% Consumer Price Index of All Items in the United Kingdom (Index 2010=100, Monthly, Not Seasonally Adjusted)
fred_InflationRate = getFredData([CountryCode3L,’CPIALLQINMEI’], StartDate, EndDate,’pca’,’a’,’avg’)
else
% Consumer Price Index of All Items in the United Kingdom (Index 2010=100, Monthly, Not Seasonally Adjusted)
fred_InflationRate = getFredData([CountryCode3L,’CPIALLMINMEI’], StartDate, EndDate,’pca’,’a’,’avg’)
end
OECD_InflationRate(:,ii)=fred_InflationRate.Data(:,2);
if ii==1
annualdates=fred_InflationRate.Data(:,1);
end
trace1= struct(‘x’, {cellstr(datestr(annualdates,’yyyy’))},’y’,OECD_InflationRate(:,ii),’name’, CountryName,’type’, ‘scatter’);% ,’line’, struct(‘color’, ColorString));
data = {data{:}, trace1};
end
layout = struct(‘title’, ‘Inflation Rates in Various Countries’,’showlegend’, true,’width’, 800,’xaxis’, struct(‘domain’, [0, 0.9],’title’,’Year’), …
‘yaxis’, struct(‘title’, ‘Percent (Annual Rate)’,’titlefont’, struct(‘color’, ‘black’),’tickfont’, struct(‘color’, ‘black’),…
‘anchor’, ‘free’,’side’, ‘left’,’position’,0) );
response = plotly(data, struct(‘layout’, layout, ‘filename’, ‘SomeOECD_InflationRates’, ‘fileopt’, ‘overwrite’));
response.data=data; response.layout=layout;
saveplotlyfig(response, [‘./Graphs/SomeOECD_InflationRates.pdf’])